Skip to content

Connect

How can a municipality sustain the growth and safety of its city?

The policy question

A community lives better when its streets and public places work for the people who use them. These applications read the state and the use of each place.

The State hears its communities and acts on what it hears, with a return it can measure: roads, public spaces, the environment and city services.

Sovereign intelligence lets a State read its own country as it changes, and act before problems arise.

The questions on this page

Every case study follows the same four steps: map, reimagine, accelerate and learn.

How we help governments develop smart cities and strengthen communities

Connect covers how a government listens to its communities. It reads the signals that cities, public places and public services already give, and acts where the response pays back.

01

Cities and public space

How cities plan their land, infrastructure and public places, and how digital services reach every community.

Questions governments bring to us

  • Where should a city place its next services and infrastructure?
  • In what condition are our roads, parks and public places, and what comes first?
  • How do digital services change the way that communities live and work?
02

Government performance and public services

How governments coordinate policy across entities, deliver services that citizens use, and measure the results.

Questions governments bring to us

  • Do our policy measures support one another across ministries?
  • Which public services are slow or hard to use, and why?
  • Which measures show that a programme delivers for citizens?

01Quality and safety of roads

How does a city keep every district connected and safe, within its budget?

The problem every city knows

  • A city cannot inspect every street every year.
  • Repairs follow the complaints, not the need.
  • Some districts stop complaining. Families there wait longest for the road to school or the clinic.

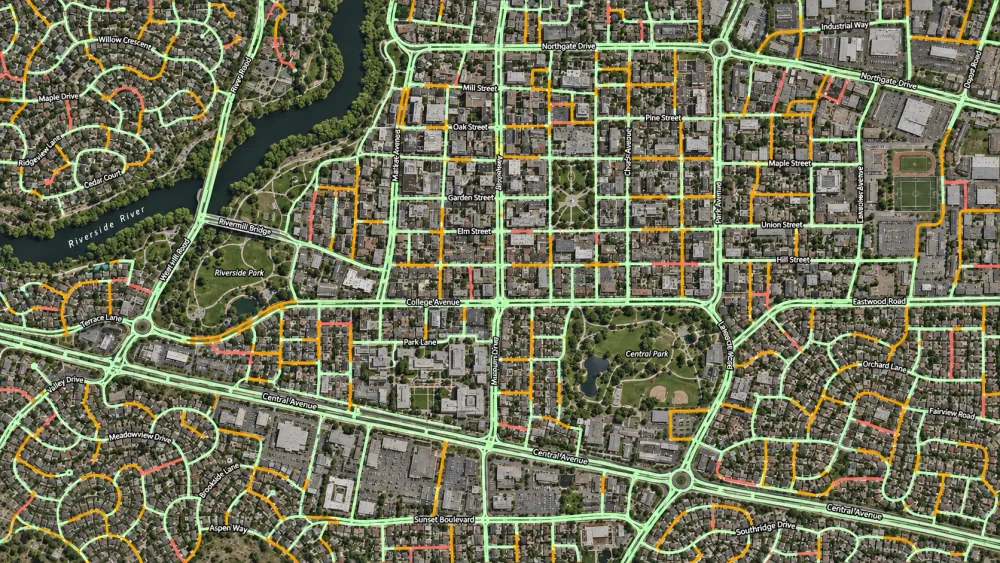
Every road segment, graded from satellite images

An AI model classifies every road segment from satellite images into condition classes. Traffic, emergency access, complaints and public transport then set the priority of each district.

How it works

A model of a city district at dusk. Each street has the colour of its condition. One broken street cuts a block of homes off from a school and a clinic, and a phased repair plan joins them again.

See every road

Whiteshield read the condition of every street from satellite images, so no district was left out.

Join every signal in one record

XShield adds traffic, public transport and complaints, and keeps one record for each district.

Find where roads cut people off

Whiteshield found the broken streets that cut homes off from school, work and care.

Plan the repairs within budget

Whiteshield ranked the districts by how cut off people are. The repair budget follows that order, phase by phase.

An illustration of the method, with synthetic data. Fictional district.

What it delivers

The model grades the whole road network, district by district, and gives each district a repair plan in phases.

  1. 01
    A condition class for every road segment.
  2. 02
    A priority for every district, with the reason for it.
  3. 03
    The cost to reach a target condition, or the best use of a fixed budget.
  4. 04
    A repair plan in phases, district by district.
A satellite image of a city district, seen from above. The model of the same district, seen from above.

An illustration of the method, with synthetic data.

A satellite view of a city with a river and two parks. Its road network is drawn in green, with some segments in amber and a few in red.
Every road segment of a city, coloured by its condition class.

Who it serves

When every district can reach school, work and care, the whole city moves.

  • Transport authoritiesA current, comparable condition score for the whole network.
  • MunicipalitiesA repair plan for each district, with the reason for each priority.
  • Finance committeesThe cost to restore the network, against the budget.
  • Procurement teamsRepair phases that are ready for tender.

02Progress of housing and construction

How does a city turn its land, its loans and its plans into homes and growth?

The problem every government knows

  • A government grants a plot and a loan, and the view stops there.
  • Without an independent record of what is built, accountability rests on self-reporting.
  • A project that drifts from its plan shows only when the gap is large.

What is built, read against what is planned

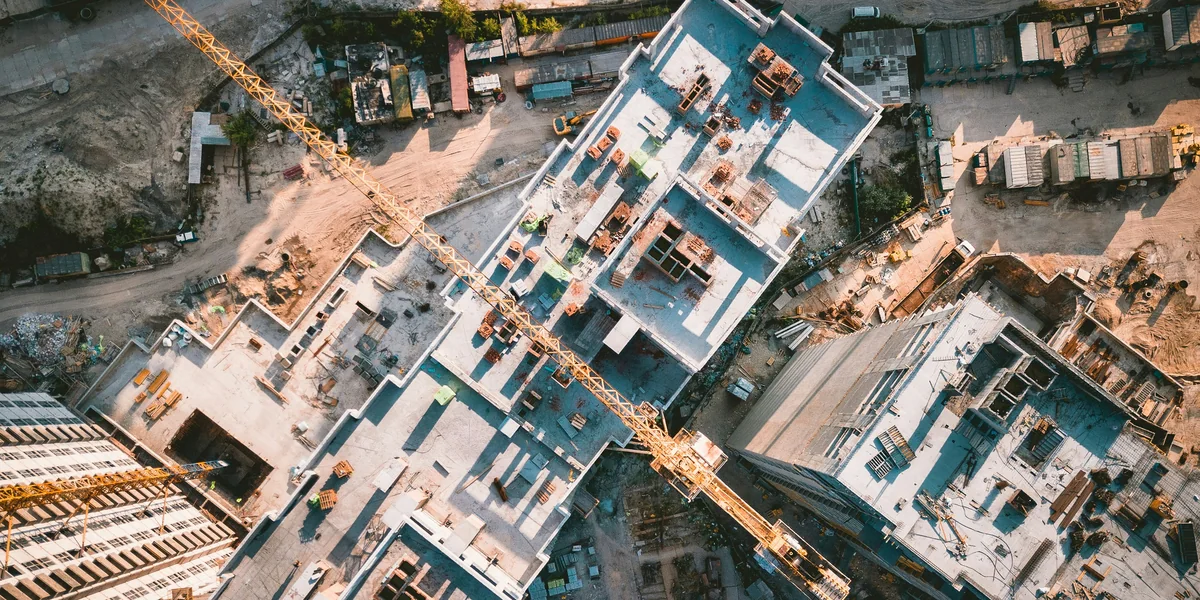
Satellite images give an independent record of what is built. Each granted plot is followed from the grant to the finished home, and each masterplan project against its plan. Each plot leased to an investor is read against its contract.

How it works

A new district of family homes seen from above at dusk. Most homes are finished and their windows are lit. One row of plots has a red outline: these plots have only a slab or a frame, or are empty.

Read each plot

The construction stage of each plot, with a dated image for each stage.

Find the cause

Progress on the ground joined to the loan and the permit separates a plot stalled for money from a plot not yet begun.

Read the masterplan

Each project against its plan, with the roads, traffic and land use around it.

Write the risk

A written risk for each project that needs review.

An illustration of the method, with synthetic data. Fictional district.

What it delivers

The application follows housing grants, masterplan projects and investment land, plot by plot, against each grant, plan and contract. A public page shows aggregates only.

  1. 01
    An independent record of what is built, plot by plot.
  2. 02
    A cause for each stalled plot: a lack of money, or work not yet begun.
  3. 03
    A written risk for each project that needs review.
  4. 04
    A measure of policy: the change in completion rates after a new funding scheme.
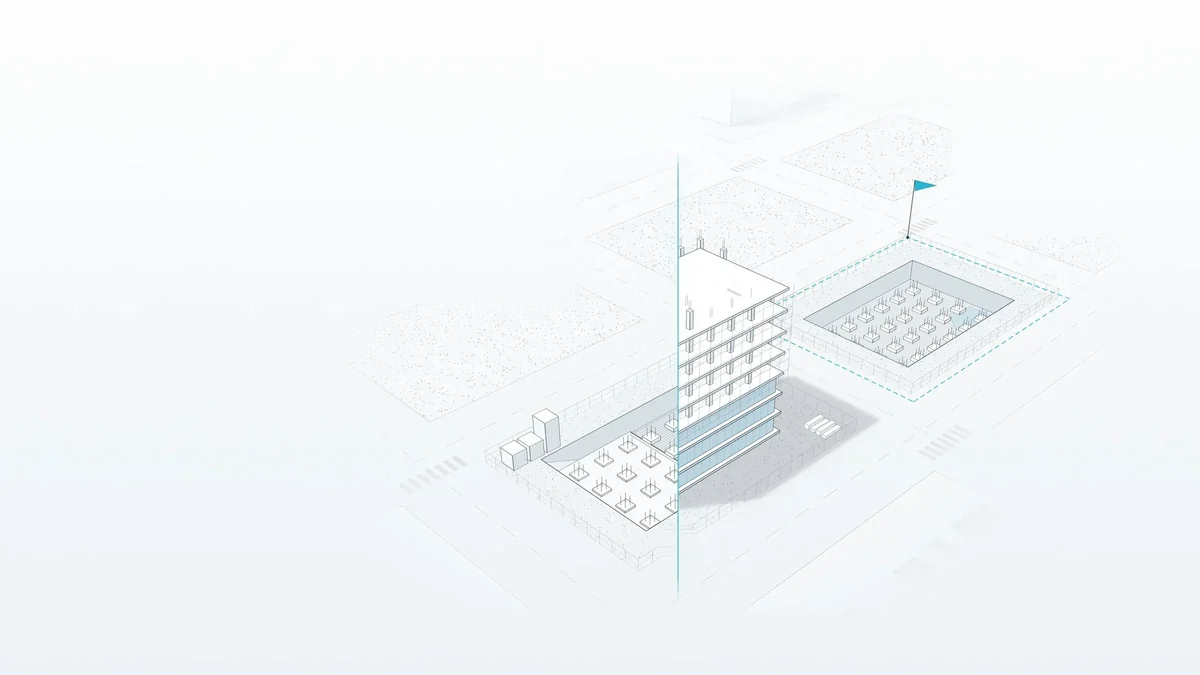
A drawing of a district plan. A building under construction stands on one plot, and a flag marks the plot beside it.

Who it serves

When each plot becomes a home, families stop waiting.

  • Housing and grant programmesPublic funding followed from the loan to the finished home.
  • Land authoritiesStalled plots found early, by district.
  • Masterplan ownersEach project against its plan.
  • Policy teamsThe effect of funding schemes and rule changes, measured in completion rates.

03Use and condition of public facilities

How does a community stay active and healthy, close to home?

The problem every city knows

  • Staff learn about the condition of public facilities from complaints or occasional inspections.
  • Nobody knows when a court is full or empty, so budgets cannot follow demand.
  • Small defects grow into expensive repairs and assets that nobody can use.

Every public court, read for use and wear

Video analysis reads the footage of each public court: how many people play, at which hours, and the state of the surface, the nets and the lights. Each problem becomes a work order before the court falls out of use. The city keeps its courts in good condition, so more people play close to home and stay healthy.

How it works

A model of a home neighbourhood in the evening, with courts between the homes. The small courts are lit and people play on them. The larger pitch is dark and cracked, inside a red outline.

Condition

Video analysis reads the state of each court: the surface, the nets and the lights.

Use

The same footage counts the people who play, by hour and by day.

Actions

Repairs, lighting and programmes are costed and ranked by the players they add and the people they serve.

Alerts

Each problem becomes a work order early, and the operator gets a weekly report.

An illustration of the method, with synthetic data. Fictional district.

What it delivers

The application follows the public sports courts of residential districts and reports each week to the operator that maintains them.

  1. 01
    The condition of each court, read from video footage: the surface, the nets and the lights.
  2. 02
    The use of each court, by hour and by day.
  3. 03
    Alerts that become work orders before a court falls out of use, and a weekly report to the operator.
  4. 04
    Costed actions, ranked by the players they add and the people they serve.
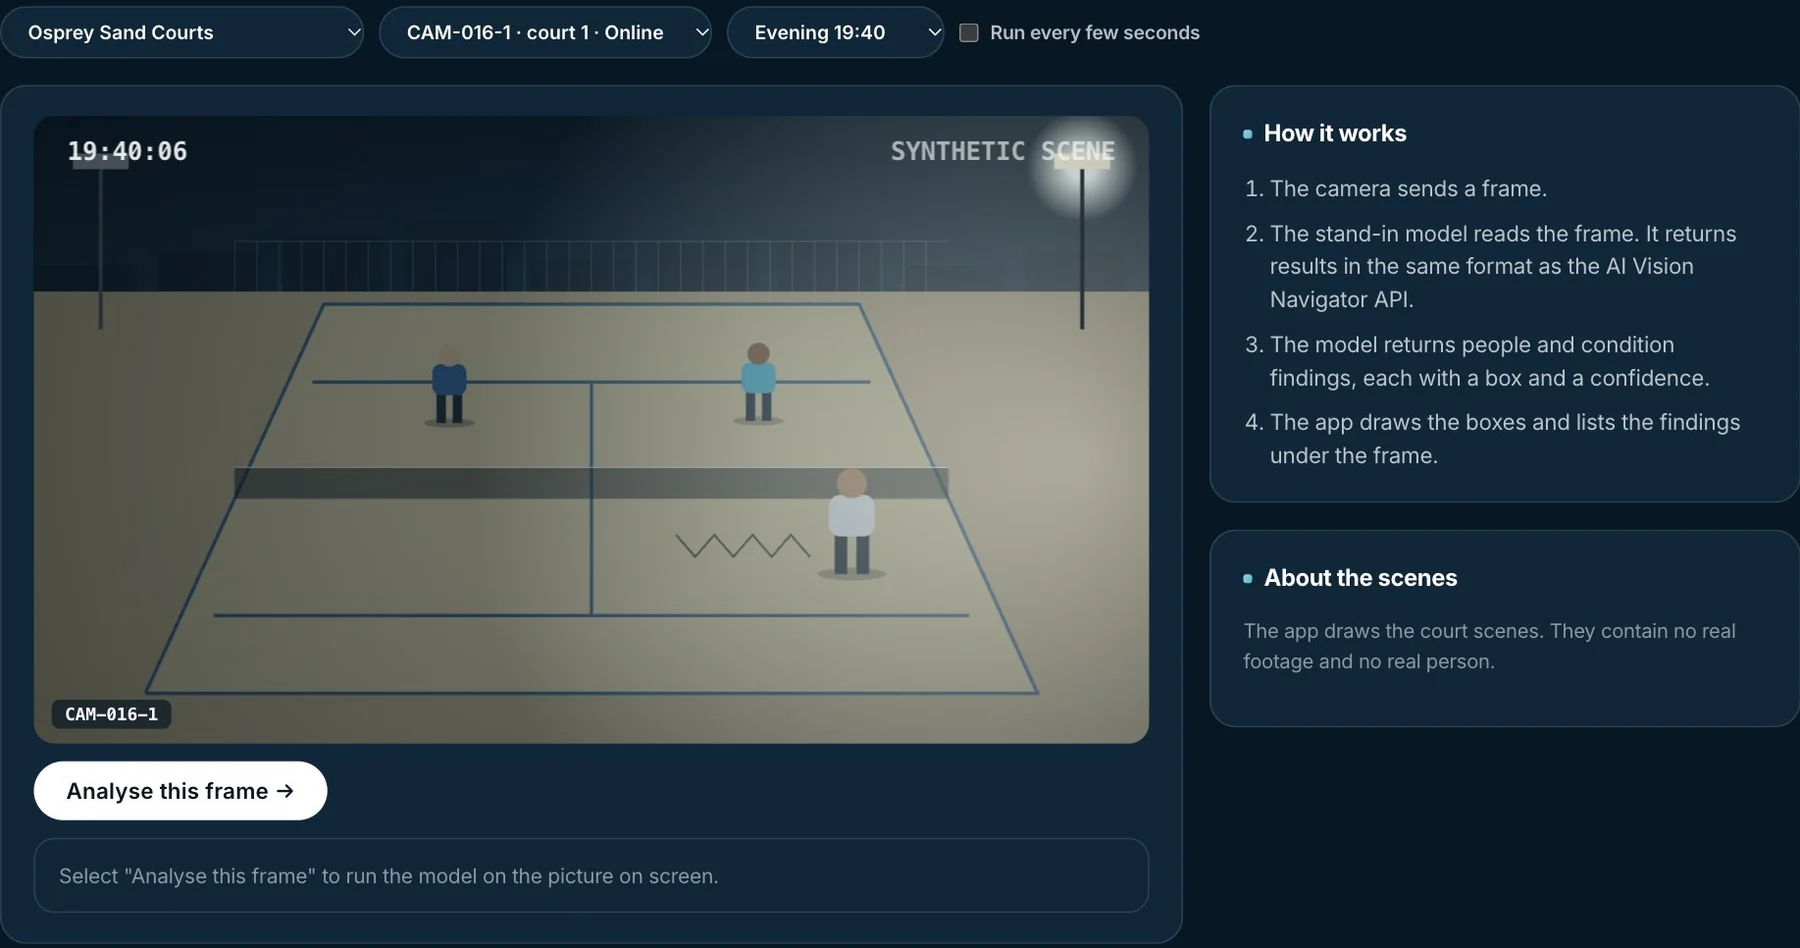
A screen of Facility Vision, the live analysis view: a drawn camera scene of a court at night with three players, and the four steps of the analysis beside it.
Facility Vision, a demonstration build of Whiteshield with drawn scenes. The model reads a camera frame and returns the people and the condition of the court.
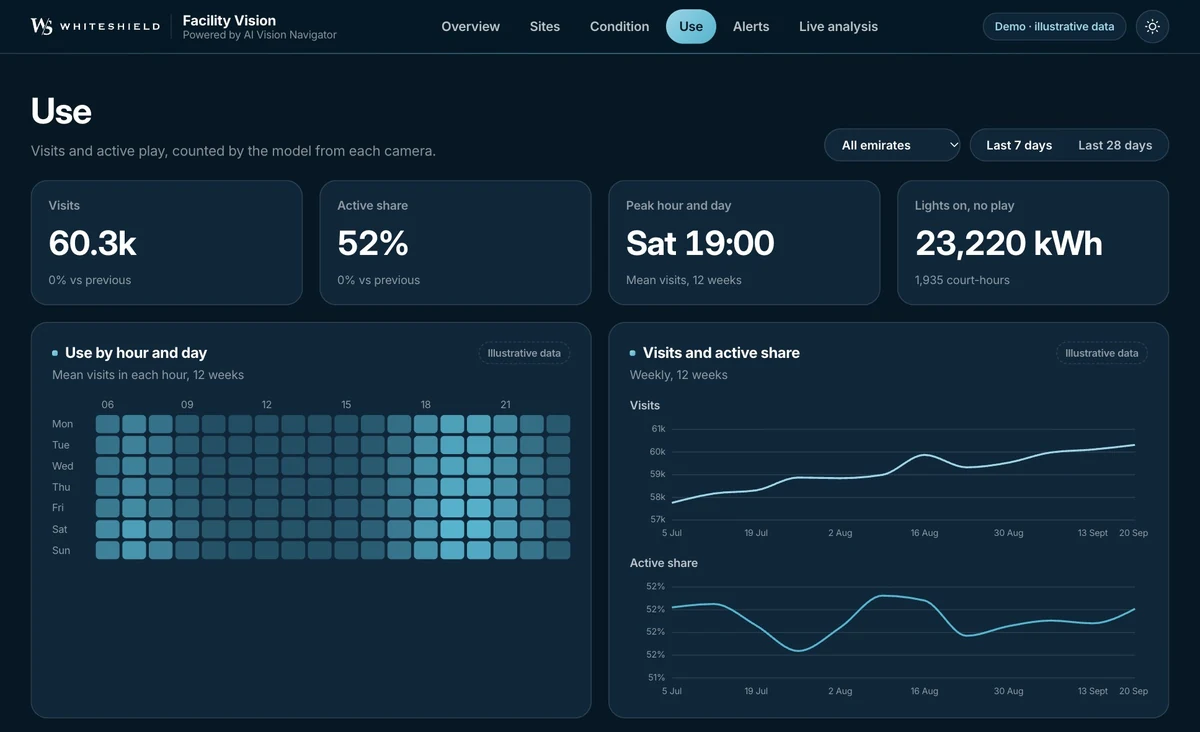
A screen of Facility Vision: the visits, the share of open hours with play, the peak hour, a grid of use by hour and day, and two lines of visits and active share by week.
Facility Vision, a demonstration build of Whiteshield. The view shows the use of the courts by hour and by day. All figures are illustrative.

Who it serves

When the court near home is in good condition, the neighbourhood plays.

  • Municipalities and operatorsA live condition register for every facility.
  • Sports and community authoritiesParticipation and use, with actions ranked by effect.
  • Urban plannersUse patterns that show where to add or convert facilities.
  • Public-health leadersPhysical activity measured where it happens.

04Illegal waste and clean land

How does a city keep its land clean and protect its environment?

The problem every city knows

  • Illegal waste sites appear faster than patrols and complaints can find them.
  • When a site is reported, it has grown and started to damage the land around it.
  • Dumping comes back to the same places, because nobody sees the pattern behind it.

Today's dumping sites and tomorrow's risk

Satellite images show illegal waste across the territory. Each site gets a waste type and a legality status. A risk surface shows where dumping is likely next.

How it works

A model of villa streets beside a river at dusk. Three open lots have heaps of waste, and each heap has a ring of light around it.

Detect

Change detection on successive satellite images finds new waste sites.

Classify

Each site gets a waste type and a legality status.

Foresee

A risk surface ranks the places where dumping is likely next.

Hand over

Each priority site goes to enforcement with its evidence, and the cleanup is tracked.

An illustration of the method, with synthetic data. Fictional district.

What it delivers

The application covers the whole territory. Inspectors go first to the sites found on the image, then to the places where dumping is likely next.

  1. 01
    New waste sites found on successive satellite images, across the whole territory.
  2. 02
    A risk surface that shows where dumping is likely next.
  3. 03
    A waste type and a legality status for each site.
  4. 04
    Each cleanup followed from the first detection to the treated site.
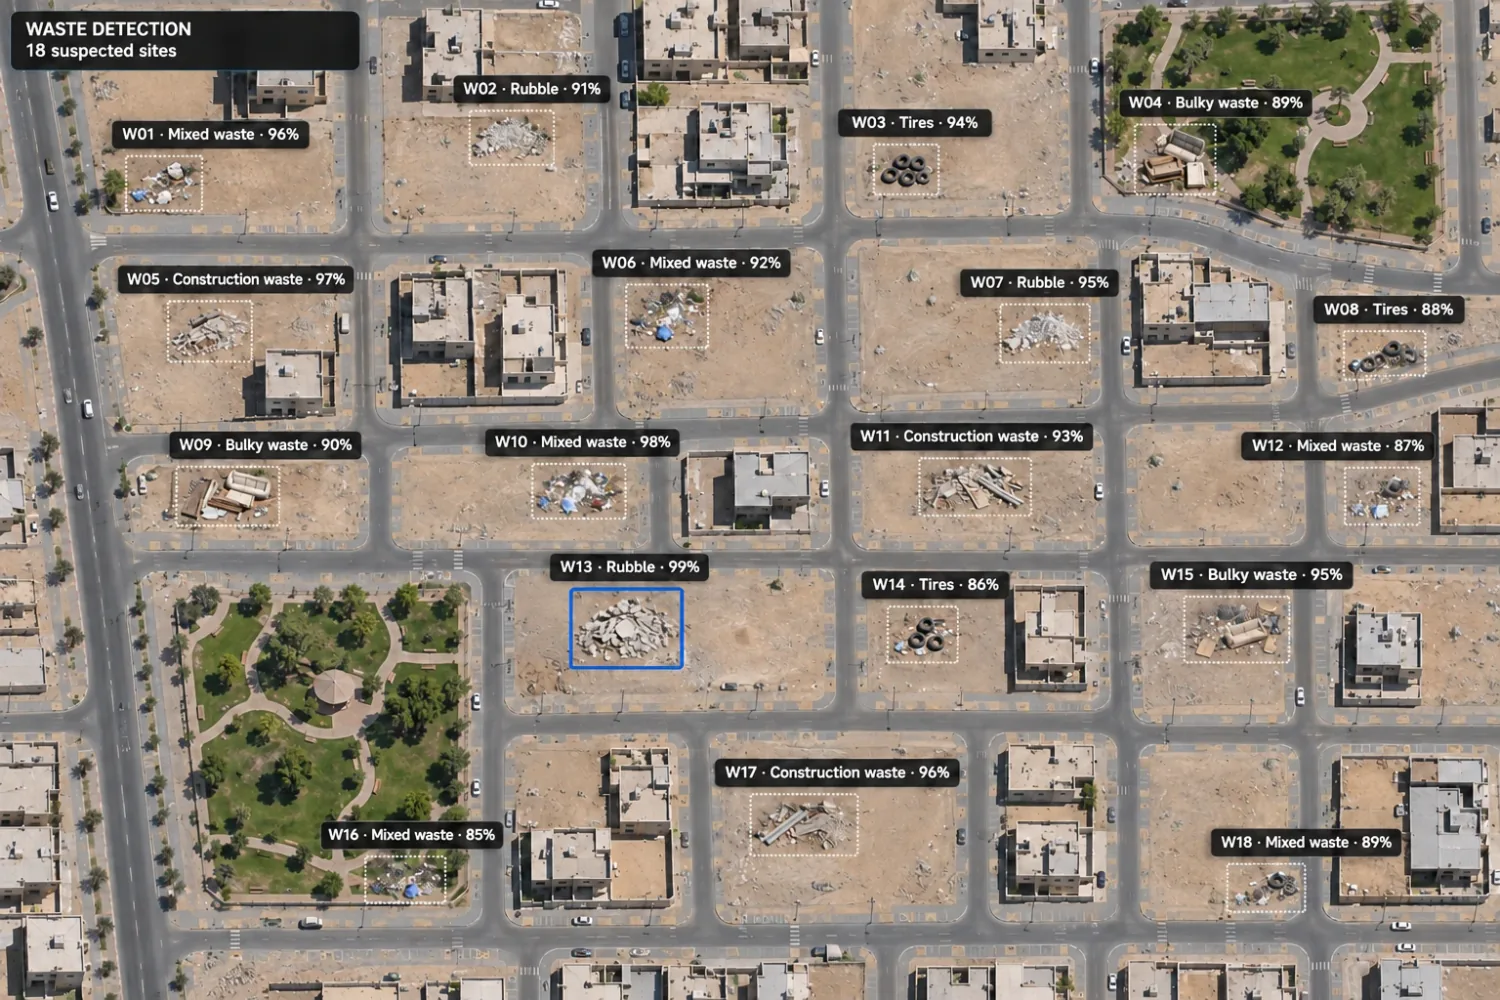
A satellite view of a residential district. Eighteen suspected waste sites are boxed, each with an ID, a waste type and a confidence score.
Each suspected waste site, with its waste type and the confidence of the detection.

Who it serves

When the land at the end of the street stays clean, families use it again.

  • Environment agenciesThe territory screened without a break, with every site typed and ranked.
  • Enforcement teamsEach priority site arrives with its evidence.
  • MunicipalitiesCleanup directed by severity and environmental risk.
  • Policy teamsRecurrence evidence that supports fines, rules and structural fixes.

How it is done

The building blocks behind each application

An application is a set of models that work on one record. A new application starts from the models that exist already.

  1. 01Measure

  2. 02Foresee

  3. 03Decide

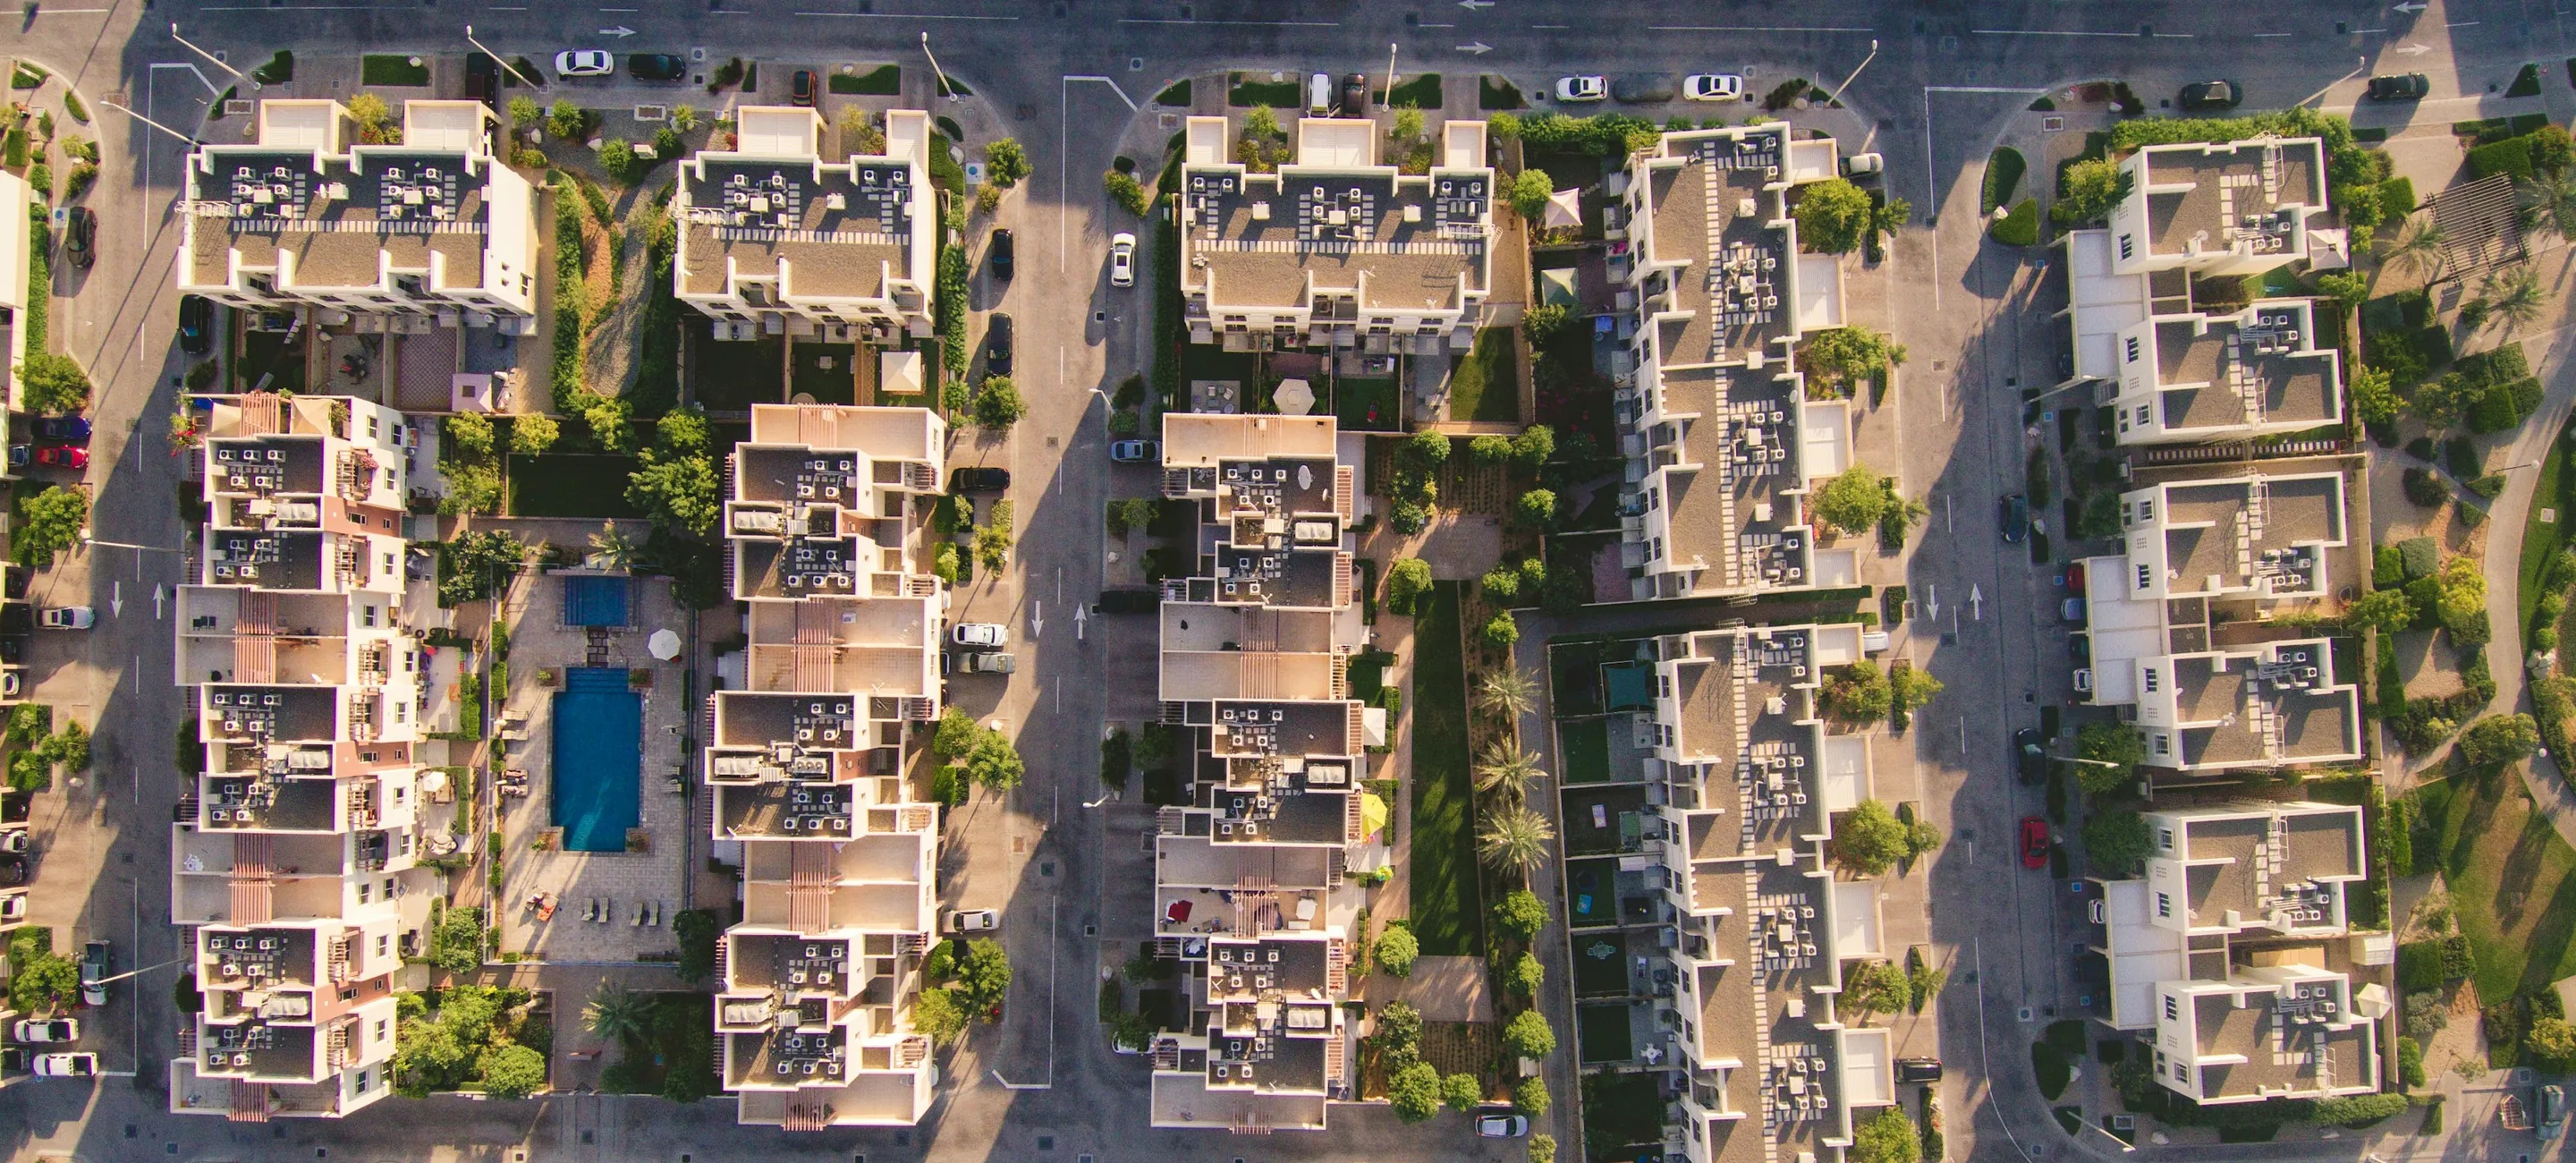
Aerial image: PNOA, © Instituto Geográfico Nacional de España (scne.es), CC BY 4.0.

Shared data

One source serves many questions

The four applications draw on the same sources, joined by place and by time. A new question adds a model and a rule to a map that already exists.

Source01Quality and safety of roads02Progress of housing and construction03Use and condition of public facilities04Illegal waste and clean land
Satellite imageryUsedUsedUsedUsed
PopulationUsedUsedUsed
TrafficUsedUsed
Land recordsUsedUsed
Camera feedsUsed
Public transportUsed
ComplaintsUsed
Loans, grants and permitsUsed
MasterplansUsed
Environmental layersUsed
Municipal recordsUsed

XShield, the memory of the StateEvery signal, fused by place and time.

What it tells us about society

A service can be personal; the reading of society stays collective.

01Quality and safety of roads

What it shows

Complaints show where residents expect the State to act. A district with poor roads and few complaints can be a district that no longer expects it.

What the State can do

The repair plan can go first to the districts where poor roads cut people off from work, school and care.

02Progress of housing and construction

What it shows

Plots that stall in one district can show families who cannot finish the build, or a process that stops them.

What the State can do

The housing programme can change its support where families stall, and see the effect in the completion rates.

03Use and condition of public facilities

What it shows

The hours of play, and the courts that stay empty, show how each community lives. An empty court near many homes can point to poor condition, no light at night, or people who do not feel the place is theirs.

What the State can do

Repairs, lighting and programmes can go to the courts where they add the most players.

04Illegal waste and clean land

What it shows

Repeat dumping in one place shows a gap: a rule that people do not know, a penalty that does not apply, or a collection service that does not reach them.

What the State can do

The State can fix the cause, with a collection point, information or enforcement, and also clean the site.

Start with your own policy question

Tell us the question your government must answer. A Forward Deployed Policy Architect (FDPA) will show what the platform can do with your own data.

Gianmarco MazzocchiMission Head, Connect
Book a demo

Read our privacy and cookie details