Skip to content

Provide

How do firms and cities serve people in the right place, at the right time?

The policy question

People and firms do well when stores and services are where people are, and open when people come. Two readings show it: one of the whole network, one of each store.

People and firms earn a living and grow. Governments attract investment and open new routes for trade.

Sovereign intelligence lets a State read its own country as it changes, and act before problems arise.

The questions on this page

Every case study follows the same four steps: map, reimagine, accelerate and learn.

How we help governments grow the economy and attract investment

Provide covers the economy that creates jobs: trade and supply chains, the industries that an economy can grow, and the public finances behind them.

01

Trade and supply-chain resilience

How national trade systems absorb disruption, adapt and recover, and which trade policies protect growth and jobs.

Questions governments bring to us

  • How exposed is our trade to tariffs, fragmentation and supply-chain shocks?
  • Which partners, products and corridors make our trade more resilient?
  • What did a trade reform or a public-private partnership change for trade, jobs and growth?

02

Economic complexity and industrial policy

What an economy knows how to produce, and which new products, sectors and places it can grow into.

Questions governments bring to us

  • Which productive capabilities does our economy have today?
  • Which new products and value chains are within reach?
  • Which regions and cities should receive new activity?

03

Public finance and economic measurement

How governments measure the economy and the public accounts, and how fiscal choices affect growth, spending and debt.

Questions governments bring to us

  • Which indicators should we track at national, regional and city level?
  • How do we measure economic activity where survey data is late or missing?
  • How will a fiscal choice affect growth, spending and debt?

Satellite image: Sentinel-2 cloudless by EOX IT Services GmbH (contains modified Copernicus Sentinel data 2016), CC BY 4.0.

01Trade Navigator

How does a country keep its trade open when a route closes or a tariff changes?

The problem

  • A closed route or a new tariff changes the cost of trade in days.
  • Official trade statistics show the effect months later.
  • Without a model, a government cannot compare its options before it decides.

Each trade flow, tested against a closure or a tariff

A trade model holds the trade between each pair of countries, product by product, and the routes that carry it. It tests a closure, a tariff or a new cost before the decision.

  1. 1Trade between each pair of countries, product by product, comes from public trade statistics.
  2. 2Each flow takes its route by sea or by air, through the ports and the corridors that carry it.
  3. 3A scenario closes a port or a corridor, or adds a tariff or a cost, for a product, an origin and a destination.
  4. 4The model gives each flow a new route and a new cost. A part of the cost passes to the import price, and demand responds by the elasticity of each product.
  5. 5The model is tested against past disruptions of trade.

What it deliversThe change in trade for each country and each product, the cost of each route, and the path week by week.
  • Route before
  • Closed corridor
  • Route after
An illustration of the method, with synthetic data.
A screen of the Trade Navigator: the routed value of trade for one reference year, a bar for each product chapter, and a map of the sea routes.
The Trade Navigator, a demonstration build of Whiteshield. The view shows the trade of one reference year by product chapter, from public trade statistics, with the sea routes that carry it.

Who it serves

  • Trade ministriesThe exposure of each product and each partner to a closure or a tariff.
  • Ports and customs authoritiesThe routes and the volumes that move when a corridor closes.
  • Finance ministriesThe effect on import prices and on customs revenue.
  • Industry and supply-chain teamsThe products at risk, and the other routes and suppliers.

02Retail network

How does a network of branches or stores stay close to the people it serves?

The right place for every branch and store

Geospatial analysis reads each location of a city on more than 50 data points: demand, access, competition, residents and economic activity. It then recommends where a network should keep, move, open or close a branch, a store or an ATM.

How it works

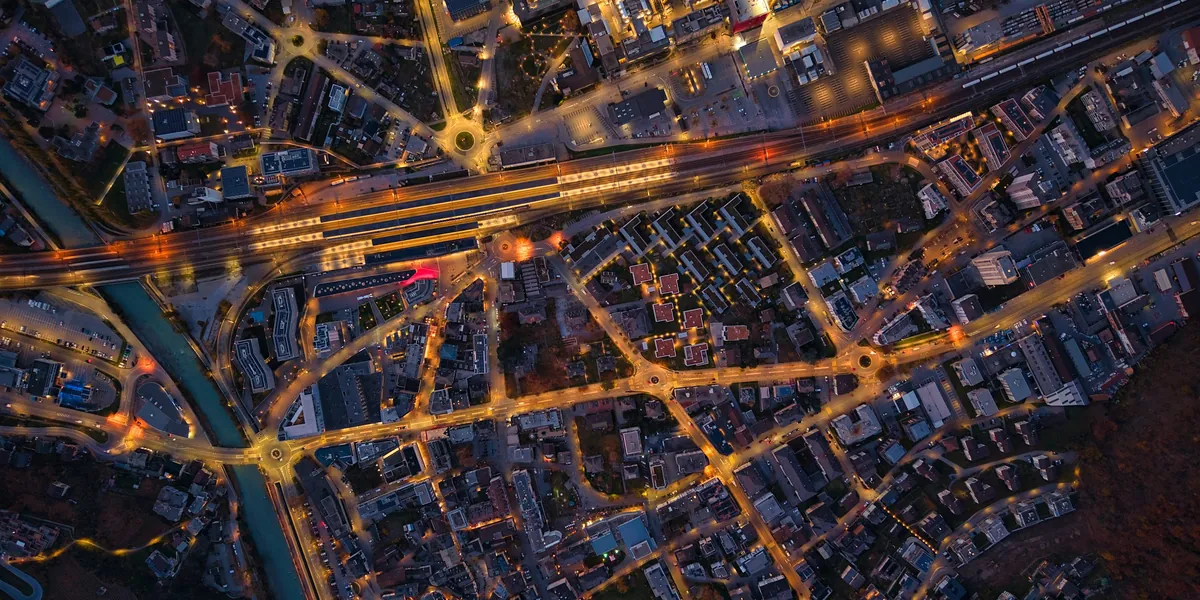
A model of a city district at dusk, seen from above. Small lights mark the branches of one network. One bright area of homes has no branch.

See the network on the map

Each branch or store of the network goes on the map of the city, with the competitors around it.

Join the signals of each area

One record for each area holds its footfall, its residents and its competitors.

Find the areas the network does not reach

The analysis finds the areas where many people live and pass, and where the network has no branch or store.

Plan where to open and where to move

The analysis recommends the place for each new branch or store, and the branches or stores to move.

An illustration of the method, with synthetic data. Fictional district.

What it delivers

The analysis shows a firm where its network should be. A large bank in the UAE used this analysis to decide where to open, close or move its branches and ATMs.

A satellite image of a city with a street grid. Points mark the branches of one network. A dashed ring marks an area of homes with no branch.

An illustration of the method, with synthetic data. Satellite image: Sentinel-2 cloudless by EOX IT Services GmbH (contains modified Copernicus Sentinel data 2016), CC BY 4.0.

  1. 01
    The best places for new branches, stores or ATMs.
  2. 02
    Openings, moves and closures ranked against the objectives of the firm.
  3. 03
    A first analysis with no data from the firm.
  4. 04
    The branches or stores to move, and where to move them.
  5. 05
    One view of the network against footfall, residents and competitors.

03Footfall and activity

How does a store serve people at the hours when they come?

Each store, read hour by hour

AI vision reads camera images at a store, a branch or a mall. It counts the people who pass and the people who come in, by hour and by day.

How it works

A street of stores in a model city at dusk. Small points of light move along the pavement, and some turn in at the doors of the stores.

See who passes and who comes in

AI vision counts the people who pass a store and the people who come in.

Join the counts by hour and by day

The counts join into one record for each store, by hour and by day.

Find the busy hours and the quiet hours

The record can show when a store is busy, when it is quiet, and when it is closed while people pass.

Plan the hours and the position

A firm can fit the opening hours of each store to the hours when people come, and compare the positions of its stores.

An illustration of the method, with synthetic data. Fictional district.

What it delivers

The reading shows a firm how people use each store through the day: when they pass, when they come in and when it is busy.

  1. 01
    Counts of the people who pass and the people who come in, by hour and by day.
  2. 02
    The busy hours and the quiet hours of each store.
  3. 03
    The hours when a store is open, against the hours when people come.
  4. 04
    A comparison of stores by position: on a street or inside a mall.
An illustration of the method, with synthetic data.

From the economy to the street

One shock, read at every scale

A change in a tariff, a tax or the price of oil starts far from the street. Economic models follow it through trade and through each sector. Geospatial analysis and AI vision read the same economy from the ground: each district, each network, each store.

  1. 01

    The shock

    A tariff, a tax, a change in the price of oil, or a trade route that closes.

    Scenario

  2. 02

    Trade

    The cost of each import and each export changes, product by product and partner by partner.

    Trade model

  3. 03

    The sectors

    A model of the whole economy carries the change to the output, the jobs and the public revenue of each sector.

    General equilibrium model

  4. 04

    The city

    Geospatial analysis shows where firms and people are, area by area.

    Geospatial analysis

  5. 05

    The store

    AI vision shows how people use each place, hour by hour.

    AI vision

The model of growth

From world demand to the growth of each sector

The work on growth stands on a model of the whole economy. The model follows a change in demand through five levels, from the trade partners of a country to its gross domestic product (GDP) and its budget.

  1. 01

    World demand

    Scenarios set the demand of each trade partner and the price of each commodity.

  2. 02

    Exports and imports

    A trade model turns that demand into the trade of each product with each partner.

  3. 03

    Output by sector

    An input-output table carries the change in trade to the output of each sector and of its suppliers.

  4. 04

    GDP and jobs

    The output of each sector gives its value added, its jobs and its wages. The sum of the value added is the GDP.

  5. 05

    Public revenue

    Value added, wages and trade give the tax revenue and the customs revenue of the budget.

The AI layer

  • Nowcasting estimates GDP and trade for the present quarter from new data signals, before the official figures.
  • Language models read tariff schedules and trade agreements. They code each measure by product and by partner.
  • A general equilibrium model gives the counterfactual: the economy with a policy and the economy without it.
  • The forecast is tested against past national accounts before it is used.

Where growth can come from

The products within reach of an economy

An economy grows when it makes new products with the capabilities it already has. The analysis finds those products in four steps.

  1. 01
    ReadTrade data shows what the economy exports today, product by product, and to which markets.
  2. 02
    RelateProducts that need the same capabilities stand close together. The method is economic complexity.
  3. 03
    RankEach product within reach is ranked by world demand, by its distance from the present capabilities and by the jobs it brings.
  4. 04
    PlaceGeospatial analysis shows the zones and the land where each sector can grow.
Opportunity: demand with no exporterAn illustration of the method, with synthetic data.

What it tells us about society

A service can be personal; the reading of society stays collective.

02Retail network

What it shows

The places where firms open and close show which districts the market serves. A district with many residents and few stores or services can be a district that the market does not see.

What the State can do

A firm can reach the people it does not serve today. A city can see which communities have few services close to home, and plan land use and public services for them.

03Footfall and activity

What it shows

The hours when people come, and the places that stay empty, show how each district lives through the day.

What the State can do

A firm can open when people come. A city can fit transport, lighting and public services to the hours when people use each district.

Start with your own policy question

Tell us the question your government must answer. A Forward Deployed Policy Architect (FDPA) will show what the platform can do with your own data.

Tom FlynnMission Head, Provide
Book a demo

Read our privacy and cookie details